Tuesday, December 30, 2008

Australian Dollar Consolidating Now

Through the end of 2012, I am one of those expecting a shift in economic power from Western economies (namely the US) to Eastern economies (China, Japan, etc). In particular, Australia, as a producer and exporter of precious metals -- which stand to rise when fiat currencies are troubled -- and commodities as well, may find its currency in greater demand.

So is it time to buy the Australian dollar? Let's take a look at the price chart to get an idea if now is the time.


After being in a strong bear market since August 2008, the Australian dollar is now rallying. It is currently forming an ascending triangle/rising wedge pattern, as the chart above illustrates. The hourly and weekly chart also show consolidation, suggesting the market may be ready for a breakout.

For US stock market traders, FXA is an ETF that tracks the Australian dollar.

Disclosure: Long Australian Dollar.

Sunday, December 28, 2008

Banks Are Lending And Money is Abundant Again

Monitoring the money supply can be a useful tool in understanding "the big picture" of what is going on in the economy. Towards the end of the summer/early fall of 2008, we saw money supply indicators, like MZM, contract. This was the result of deleveraging; in our debt-based economy, in which all money originates out of debt, paying off debts reduces the money supply -- while the issuance of debts increases money supply. Thus, the combination of deleveraging (paying off debts) with a decrease in bank loans resulted in the money supply contracting, the dollar strengthening, and asset prices falling -- all characteristics of deflation.

These trends seem to be reversing. The chart below tracks MZM; note the recent spike upwards.


Likewise, the TED spread -- an indication of fear and risk in the market, and whether or not banks are lending -- has been declining. A lower TED spread means less fear and more lending. The increase in money supply makes sense with a lower TED spread. Both run contrary to reports from much of the media that banks are still unwilling to lend.

The chart below illustrates the TED spread; note it has declined significantly from its peak in October, when the psychology of fear was at its peak.


In terms of financial markets, we've seen the dollar weaken of late, while gold has been rising. This is consistent with the behavior of MZM and the TED spread.

Disclosure: Long gold.

Saturday, December 27, 2008

Taking A Look at the Reversal in the Japanese Yen

The Japanese Yen has been strengthening against the world's other currencies for the past few months. For the time being, however, this trend seems to have reversed. The charts below tell the story.

CHFJPY - Note the recent strong uptrend.


EURJPY - Ascending triangle formation in the works.


USDJPY - Moving averages turning upwards, and price trading above moving averages.


Personally I've been in and out of short USDJPY since 101.30; I just closed my most recent USDJPY short position, as I think a short-term reversal of sorts may emerge. Still, though, I think the long-term trend of yen strength will continue. Accordingly, I'll look to re-enter on a break below 88.00, or possibly 85.00.

Yen traders may also find the recent comments of Akio Mikuni, president of credit ratings agency Mikuni & Co., to be of interest. Mikuni said:

Japan’s economic model has been dependent on external demand since the Meiji Period that began in 1868. The model where the U.S. relies on overseas borrowing to fuel its property market is over. A strong yen will spur Japanese domestic spending and reduce import prices, thereby increasing purchasing power.

Mikuni said the USDJPY could fall to 50 or 60 from its current price of just aboe 90 unless Japan takes "drastic measures" to help bail out the US economy.

Disclosure: No position.

Friday, December 12, 2008

Analyzing The Housing Sector and Opportunities to Short XHB

Let's take a look at the housing market, and potential trading opportunities it presents.

Fundamental outlook: Fundamentally, the housing market is still very much in a bear market. According to Austrian business cycle theory, the housing market represents a good short opportunity, as the housing bubble fueled by credit expansion is now being deflated as credit has become more scarce. Economist Mike Shedlock recently had a great post analyzing the housing market, in which he called for a bottom to be 3-5 years away, as we recently discussed.

The excess number of houses already created in the US as a result of the housing bubble, coupled with increasing job losses and tightening credit, makes shorting homebuilders an interesting proposition. US stock market traders can look to short XHB, an ETF tracking homebuilders, to capitalize on this opportunity.

Technical outlook: Technically, there has been some talk of a market reversal getting ready to happen, like we recently discussed. At the time of this writing I'd still prefer to see additional confirmation that a reversal is indeed forming -- preferably gold sustaining a break above 850 -- but if indeed we see a reversal of the trends we've seen for the past few months and the US stock market does rally, it could translate into an opportunity for traders to get short XHB at a higher price.

Below is a chart of XHB that offers some insight into key price levels traders looking to get short may want to watch.


Click to see enlarged image.

Disclosure: No position in XHB or any housing investment.

Discuss on InformedTrades

Thursday, December 11, 2008

Is a Reversal Shaping Up in the Markets?

There's been an increasing amount of talk lately that the US stock market market is gearing up for a rally, and that we're set to see a reversal of the market trends that have dominated the last few months of trading. Let's take a look at key signs of a reversal and corresponding trading opportunities.

1. Gold is rallying and is currently at an eight week high. GLD, an ETF that tracks gold, also appears to be rallying, as it is making higher highs and is testing key resistance at 81.72. A break above this level could provide momentum traders with the confirmation they are looking for.


2. Likewise in the forex market, we see EURUSD reaching breaking past key resistance at 1.3250, and USDJPY breaking below 92.00. A break below 91.00 may be a great opportunity for USDJPY traders looking to trade the longer-term trend to 85.00. For stock market traders, the FXY ETF may be of interest in capitalizing on this.

The Bigger Picture

If the rally is sustained, I would view it as a resumption of longer-term trends in the dollar and gold (weak dollar, rising gold), but a counter-trend correction in the US stock market (whose longer term trends is bearish in my opinion). In terms of gauging the overall health of the US economy, I would look to measure any gains in the US stock market in comparison to losses against the US dollar; if the stock market is rising but the dollar is falling, it may suggest an increase in nominal, but not in real value.

Discuss on InformedTrades

Monday, December 8, 2008

A Beginner's Guide to Understanding Currency Valuation

The market value of asset is largely a reflection of supply and demand for that asset. And thus, if we are looking to assess the value of a currency, we should try to gauge the supply of and demand for that particular currency.

Understanding Supply

To understand money supply, it is crucial to note that in under current monetary policy, money is created out of debt. This happens in two ways:

1. Money is created when governments need to borrow, and central banks then print money and buy treasury bonds
2. The money supply is then expanded again when banks loan money; banks are allowed to loan out 10X the money they have in deposits, and thus expand the money supply when they loan.

Because money comes out of debt, we can extrapolate two further points:

1. If there is no more debt -- meaning if lenders are not willing to lend and borrowers are not willing to take on more debt -- the money supply will have difficulty expanding.
2. Paying off debts results in decreasing the money supply. Ironically, if all debts were repaid, there would be no money.

There are a number of ways to calculate the money supply; see our previous post on this subject. The Mises Institute also offers a free tool to let you compare various money supply indicators.

Understanding Demand

The following can help you gauge demand for a currency:
  • Trade flows
  • Capital flows
  • Reserve currency status -- do other central banks hold the currency in question as part of their reserves? Are they changing their reserves?
  • Commodity prices -- If commodity prices are rising, the currency is likely weakening
Gauging how supply and demand is changing can help you develop a longer-term outlook on how currency prices will fare.

Discuss on InformedTrades

Friday, December 5, 2008

Comparing the Crisis in the Icelandic Krona to the Crisis in the US Dollar

We recently compared the crisis with the Argentinian peso in 2001/2002 with the current situation surrounding the US dollar, and postulated that the US would follow down the Argentinian path.

The current situation in Iceland also fits the bill of a currency crisis (also referred to as an inflationary depression). To illustrate this point, let's compare the factors leading up to the crisis in the Icelandic krona with the conditions of the US macroeconomy:

1. Like the US, Iceland de-regulated much of its banking sector in the '90s.
2. Like the US, Iceland then proceeded to target low interest rates. This resulted in a large amount of borrowing and spending, which resulted in a credit-based boom.
3. In both countries, de-regulation allowed for greater securitization -- meaning the loans that enabled this credit-based boom were re-packaged and sold to debt buyers all over the world. This resulted in a scenario where much of Iceland's wealth was owned by foreigners.
3. Like the US, Iceland also experienced the contraction forecasted by the Austrian business cycle theory, which we recently discussed.
4. In both countries, this resulted in a deflationary spiral: significant declines in equities markets, bank failures, and contracting GDP.

To learn more about the factors leading up to the Icelandic currency crisis, I recommend this article from CNN.

Now in Iceland, like in Argentina, the true breaking point came when its central bank became insolvent. The result was a complete lack of confidence in Iceland's ability to repay; essentially, Iceland had defaulted. The result has been a run on the Icelandic krona, which has lost half its value in just a few months time.

Government Response

Or should I say, there has been a partial run on the Icelandic krona -- for the government has put currency controls in place, after raising interest rates. Citizens of Iceland will find it difficult to legally exchange their krona for a foreign currency unless they are travelling.

Proposed solutions include integrating Iceland into the Eurozone, which would help stabilize Iceland, continue international trade, and help ensure that lenders are repaid, argue its proponents.

Social Response

Icelanders have united in protest against the government, in much the same way Argentinians did after their currency crisis. Thus far in the United States, criticism and dissatisfaction with the government handling of this crisis have risen significantly, though street protests remain at relatively low levels.

Market Response

The collapse of the Icelandic krona is the biggest event, as it devalues all assets denominated in the krona, as was the case in Argentina. A key difference between the US dollar and all other currencies, though, is that the US dollar is the world reserve currency. It will be interesting to see if Iceland enters the Eurozone as a solution to this crisis; if so, it paves the way for the creation of a world currency to be proposed as the solution to a crisis in the US dollar.

Discuss This On InformedTrades

Wednesday, December 3, 2008

Using Austrian Business Cycle Theory to Invest in the Current Depression

I know I've talked about Austrian business cycle quite a bit in my blog posts, but I wanted to make a post that provides a clearer introduction to it and its logic. So here goes.

Austrian economics and Austrian business cycle theory have regained a bit of popularity of late, given the recent turmoil in the financial markets. Understanding Austrian business cycle theory can help us understand where things are headed, so that we can invest accordingly.

What it is: Austrian business cycle theory basically posits that bubbles and busts result primarily from an overexpansion of credit. Credit is too cheap and too easy. Entrepreneurs are trained in finding market opportunities and inefficiencies in the market; and thus, the Austrian business cycle posits, entrepreneurs as a whole can only be collectively mislead for a sustained period if credit is excessively expanded. This will cause entrepreneurs to excessively invest in capital-intensive projects, like building houses.

The result: The result of this excessive expansion is that the market will eventually try to deflate and purge the misguided investments out of the market. This will result in deflation.

What government policy should be: According to Austrian business cycle theory, deflation is good, and government policy should be to embrace it -- not avoid it. Deflation will encourage "hoarding of cash," which is perhaps more accurately referred to as savings. These savings will then form the basis for the economy to heal itself and become strong again.

What happens if government intervenes: If government intervenes to prevent deflation, one of two things will happen: deflation will be prolonged and deepened, as we see in Japan; alternatively, if government goes into greater debt while its tax base diminishes, it runs the risk of being unable to find borrowers, at which point faith in the currency is lost and a run on the currency begins -- meaning everyone looks to sell the currency, causing its value to fall and prices to rise, as we saw in Argentina in 2001 and 2002.

Which brings us to where we are today.

So the key question: how much deflation? To answer that question, consider the chart below:


Note the uptrend that begins in 1995; this is the beginning of the tech bubble, which was brought about by excessive credit expansion under Greenspan's Fed. The market tried to deflate -- this was the "dot com apocalypse" from 2001-2003 -- but the Fed lowered rates again, preventing a full deflation, and instead pushing the bubble into the housing market. A full deflation would then push S&P back to the 1995 level of around 400. Alternatively, a run on the US dollar may cause the nominal price of stocks to rise, but it will fall respective to other currencies. A way to gauge whether the stock market is truly rising in value or if it is just a nominal gain resulting from currency weakness is to compare percentage gains in stocks to gains in gold. If stocks are rising faster than gold, it could be a sign of real growth.

According to Austrian business cycle theory, if money supply was not excesively expanded but was kept at appropriate levels, there would be no real bubbles or busts. This may make the stock market less fun. Conversely, it would lead to greater focus on profitability rather than financial ratios, and a corresponding focus on dividends rather than valuations.

Discuss This On InformedTrades

Tuesday, December 2, 2008

Next Stop for the US Dollar: Argentina

Something I've touched on before but have not elaborated too much on is the similarities between Argentina in 2001 and 2002 and the US now. Here is a fantastic analysis of this subject. Below is a breakdown of the key events:

1. In 1997, Argentina experienced a recession. The government response was to ease credit -- i.e. lower interest rates -- and increase government spending, which for Argentina, would mean increasing deficit spending (i.e. borrowing and spending rather than taxing and spending). The US followed the same path in the semi-bursting of the 2002 and 2003 NASDAQ bubble.

2. The excessive easing of credit leads to inflation. For Argentina this occurred in 1998 and 1999; in the US, this peaked in the summer of 2008. During these episodes of inflation, both countries receive warnings from the IMF that their monetary policies are unstable.

3. Both countries than revert back into a recession. This time, however, they are both saddled with greater debt.

4. The recession, coupled with the increased debt burden, leads to a credit crunch, defaults on borrowed funds, and bank failures. For both countries, this results in a decrease in the money supply.

This is where the similiarities end, as we don't know how the US will get out of this situation. Will it continue to follow Argentina? Let's see:

1. During its debt ridden recession of 2000, Argentina responded by continuing deficit spending. Likewise, Barack Obama has already stated that deficit spending is not a concern, and that deficits to stimulate the economy is needed.

2. Eventually, Argentina was having trouble finding borrowers to lend it money. To make its debt more attractive, it increased its yield -- what it was willing to pay to borrow money. In the United States, we are seeing bond prices rally, and many are pointing out similiarities to other bubbles. If this is a bubble, and if it starts deflating, interest rates will need to rise to make the bonds appealing (see our previous article on this subject). Interestingly, Paul Volcker, the Federal Reserve Chairman who raised rates in the '70s to help curb inflation and tighten the money supply, has been brought on to head a new economic advisory board. Are they looking to Volcker for assistance in raising rates?

3. For Argentina, the rate hikes were not sufficient. Eventually, the diminishing tax base, bank failures, and higher interest rates made Argentina unable to make debt repayments. The result was a run on the currency. If the US cannot find buyers for its debt, the same scenario would play out here, which would result in currency devaluation.

Discuss this article on InformedTrades

What Will Be the Hottest ETFs in 2009?

As we enter the final month of 2008, it's time to start thinking about what will be hot in 2009. To start that off, I want to revisit this post I made in late September of 2008 -- a little more than two months ago -- regarding preserving your wealth in our current economic downturn. Here's a reassessment of that view:

1. My macroeconomic view remains unchanged; I still view what we're in as an inflationary depression. I grossly underestimated, though, the size of the deflationary forces, which currently are reigning supreme. Accordingly, I think we'll see deflation continue through much of next year. However, I do expect inflation to resume, perhaps some time in the second half of 2009, and I expect it to come back fairly sharply when it does.

2. I previously recommended foreign bond ETFs, particularly Asian bond ETFs like FAX, and still think they are a good buy and hold, and will do well once inflationary trends resume. However, for as long as we are seeing dollar strengthening, it will not do well -- and thus it has not done well for the latter part of 2008, and I would expect the bear trend to continue into the first half of 2009. If you're a trend follower -- which I am for everything aside from precious metals -- then you'll want to wait until the trend resumes. If you're a buy and hold type of person, now might be a time to do some bargain shopping.

3. I also recommended VEU, an ETF of foreign stocks designed to diversify against systemic US risk. I think this was an error on my part; while VEU could do well, I'm not particularly confident in it. Previously, I underestimated the size of deflationary forces not only in the US, but also in the rest of the world. I should note, though, that those who are interested in comprehensive risk diversification may still find some value in VEU.

4. My worst call was FXE, an ETF tracking the Euro. While I knew the Eurozone had problems, I underestimated the size of those problems, and I thought the Euro could replace the US dollar as the world reserve currency. While I expect the US dollar to lose its world reserve status, I no longer think the Euro stands much of a chance to replace it. I think things will just become more free-floating. A by-product of this will be that forex will become a more important market. With that in mind, I'm not interested in FXE, though as a currency trader with experience in trading EURUSD, I will probably trade EURUSD once I see signs of an uptrend resuming.

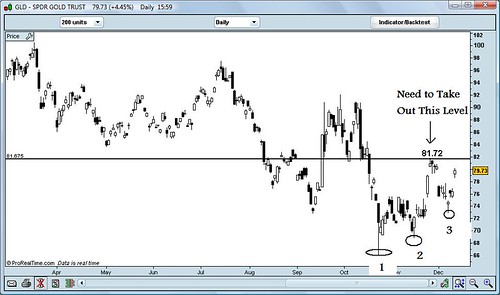
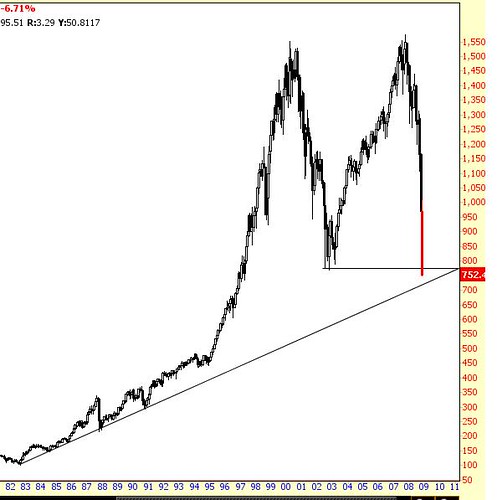
5. All forms of gold I am still bullish on -- very bullish, even more so than before. In terms of ETFs, that means GLD and GDX, the latter of which tracks gold mining stocks. As I noted, I always favor trend-following trading as a safer form of money management, but for gold, I make an exception. It's too volatile to predict and I'm extremely bullish on it, and so I am a buyer and a holder. All of that could change if gold starts to trade on COMEX below 650 US dollars, though gold has been holding up quite well against the US dollar during our current episode of deflation, so I would be a bit surprised if a break below that level is sustained.

6. The same holds true for silver, the ETF for which is SLV. I'm very bullish and still a buyer at these prices. At this point, I expect to hold gold and silver until at least 2013.

7. I previously was very bullish on oil, the ETF equivalent being USO. I view oil and the US dollar as inversely correlated in our current times, and thus I am still bullish on USO -- though it's in the same boat as my other dollar-hedge ideas, in that it is a buy and hold, and thus will require some patience until we see inflationary trends resume in 2009 or 2010.

8. I am still bullish on commodities, and thus think DBC is a good buy and hold for stock market investors. Commodities do not, however, do well during dollar strengthening, though when inflation resumes, I expect commodities to lead the way and outperform most others, save currencies and metals.

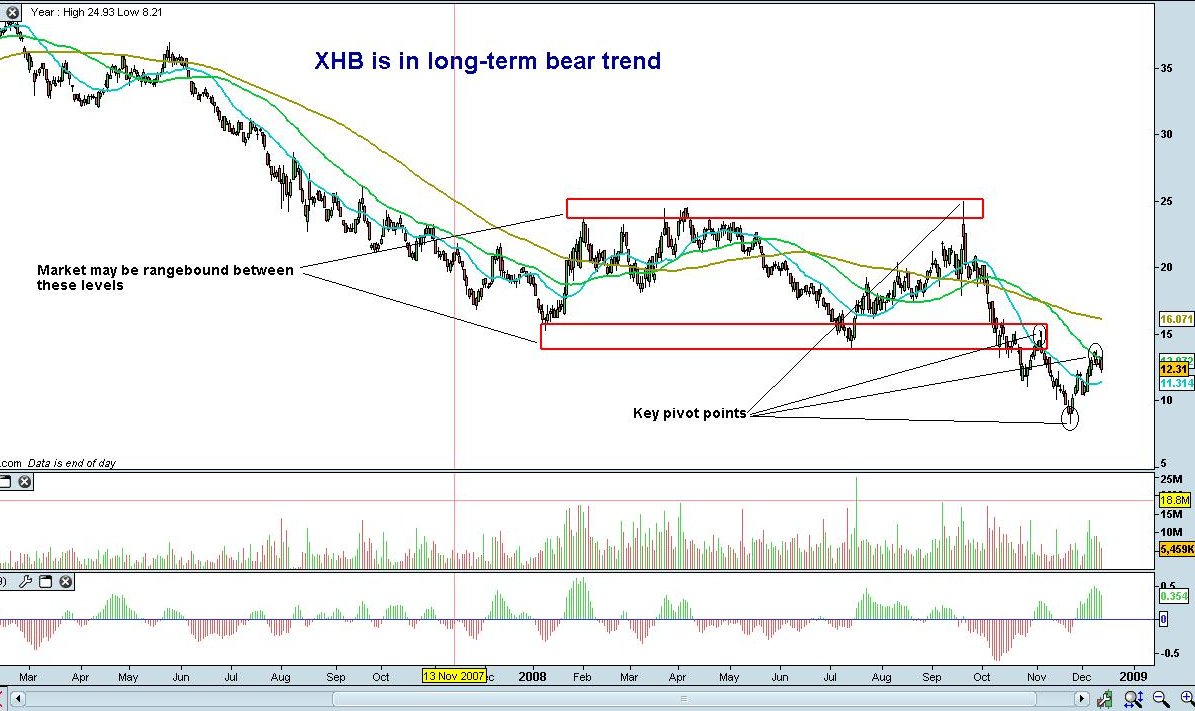
Some ETFs for the Deflationists in All of Us

I previously commented on what I think will do well in deflation, and as I expect deflation to continue into at least the first half of 2009, I still like inverse ETFs that let you short sectors and indices. SKF and SDS I am particularly fond of, and given Mike Shedlock's recent comments and what we've seen thus far, I'd add SRS to that list.

The Japanese Yen: Transcending the Inflation vs. Deflation Paradigm

Since we entered the sharp deflationary trends in September, all I've traded on a short-term basis is the yen (I've been accumulating gold and silver during this time as well, but for the long-term). This has worked out very well for me, and the Japanese Yen is a currency I expect to continue to do well, and thus look for trend-following opportunities to trade Yen strength -- particularly against the US dollar.

Money Management in 2009 and Beyond

One of the most dominant trends we've seen since September of 2008 -- which, for me, marks the beginning of the psychological shift in the marketplace, to where bearishness became the dominant mindset -- is greater volatility. Greater volatility makes money management and short-term trading even more appealing. I expect these trends to continue and be with us for quite some time.

Discuss this article on InformedTrades

Monday, December 1, 2008

How the Mumbai Militants Will Affect Financial Markets

As has been widely reported by the international media, there were recently attacks by militants in Mumbai. Here are some thoughts on how this will affect financial markets:

1. Gold. The proliferation of militant networks around the world has coincided with the emergence of a bull market in gold. The more unexpected attacks by organizations that are not nation-states we see, the more we can see a rise in gold -- and likely silver as well.

2. Defense ETFs. US President-elect Barack Obama has already declared Pakistan a threat and has suggested he may order troops into Pakistan. Moreover, in light of these recent attacks, India has already requested Pakistan take action. In the event of US entry into Pakistan, this would be a bullish sign for US defense ETFs, like ITA and PPA. It is crucial to note, however, that we are in a bear market in US equities; personally, I don't see this bear market ending soon, and thus would be reluctant to go buy ETFs and stocks that are dependent on the US macroeconomy.

3. India ETFs. ETFs that track the Indian economy on US exchanges -- namely EPI and PIN -- may see additional downward movements. These markets were already in a bear trend prior to the attacks, similar to how US markets were already in a bear trend prior to 9/11. This would be an additional bearish argument for India ETFs.

Disclosure: Long gold and silver. No positions in Defense or India ETFs.

Wikinvest Wire