
Below is a weekly chart I used to help identify a strong support level. The area highlighted is a 38.2 Fibonacci level.
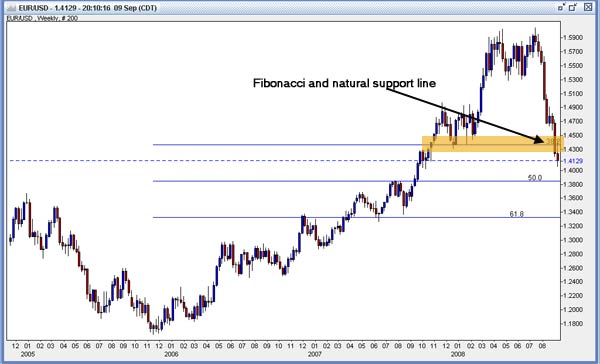
I look to the daily chart to confirm that support level, and to wait for the moving averages to align downward as confirmation that the market is trending downward.
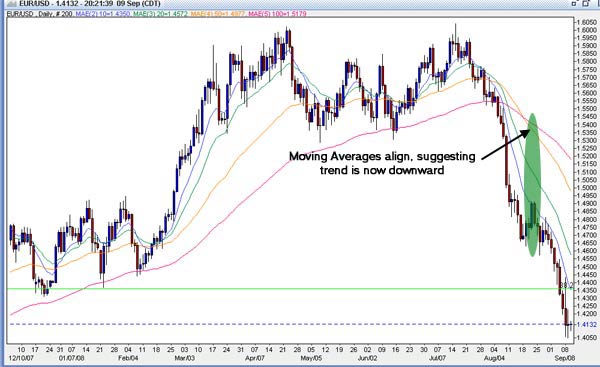
I enter on a break of support at 4321. One thing I forgot to include in the chart is the RSI indicator, which I used to check if there was RSI divergence on the break of support. There was no divergence, so I entered.
I'll exit portions of the position once the market begins to retrace and the moving averages begin to reverse.