
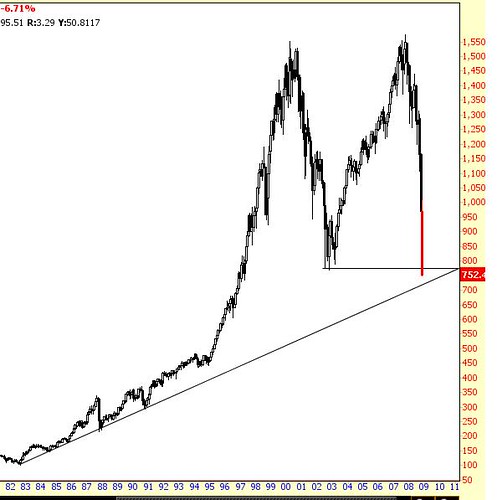
As the chart illustrates, the S&P is approaching a trendline that has been in the making since 1982.
The market may bounce off this trendline, or trade in a range for some time. But consistent with the fundamentally bearish view I have over the long-term, I think this trendline is going to break, and I don't think it will take too long -- within six months, if I had to guess (but of course, traders will let the technicals tell them when to enter).
The viewpoint from the perspective of Austrian economics is that the stock market bubbles created under Greenspan's Federal Reserve are now being deflated. The big run up from 1995 to 2001, as visualized in the chart above, was largely the result of the Fed's lax monetary policy in the early 90s; now, as debts are being eradicated, the stock market is naturally correcting itself and removing the malinvestments and excessively high prices that resulted from such an artificially lax monetary policy. Note the significant downturn in the chart above in 2002 and 2003; this was the market trying to deflate itself, though the Fed intervened again by forcing rates too low and thus resulting in an expansion of the money supply and a reinflation of assets. Now, the Fed is once again trying to to cut rates and re-inflate the market -- but it seems as though no one is buying the debt (at least for now).
A full correction of the Greenspan bubbles would result in the S&P going to at least 500, probably further, in my opinion.
Discuss On InformedTrades